“There are three kinds of lies: lies, damned lies and statistics…”
Nothing starts a good argument like pulling a statistic out of thin air—or failing to provide context. So, what have we done here at Ski Canada? In the interests of world peace, we’ve mashed up a bunch of statitstics, with a few cautionary notes attached.
by Steven Threndyle in the Winter 2014 issue
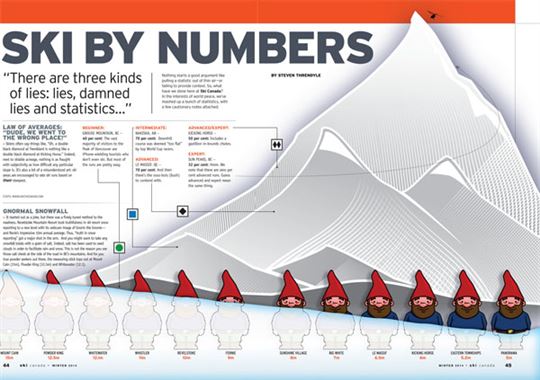
Law of Averages: “Dude, We Went to the Wrong Place!”
» Skiers often say things like, “Oh, a double black diamond at Tremblant is nothing like a double black diamond at Kicking Horse.” Indeed, next to skiable acreage, nothing is as fraught with subjectivity as how difficult any particular slope is. It’s also a bit of a misunderstood art: ski areas are encouraged to rate ski runs based on their steepest.
Stats: www.onthesnow.com
Beginner: Grouse Mountain, BC –
40 per cent: The vast majority of visitors to the Peak of Vancouver are iPhone-wielding tourists who don’t even ski. But most of the runs are pretty easy.
Intermediate: Nakiska, AB –
70 per cent: Downhill course was deemed “too flat” by top World Cup racers.
Advanced: Le Massif, QC –
70 per cent: And then there’s the sous-bois (bush) to contend with.
Advanced/Expert: Kicking Horse –
50 per cent: Includes a gazillion in-bounds chutes.
Expert: Sun Peaks, BC –
32 per cent: Hmm. We note that there are zero per cent advanced runs. Guess advanced and expert mean the same thing.
Gnormal Snowfall
» It started out as a joke, but there was a finely tuned method to the madness. Revelstoke Mountain Resort took truthfulness in ski resort snow reporting to a new level with its webcam image of Gnorm the Gnome—and Revie’s impressive 10m annual average. Thus, “truth in snow reporting” got a major shot in the arm. And you might want to take any snowfall totals with a grain of salt. Indeed, salt has been used to seed clouds in order to facilitate rain and snow. This is not the reason you see those salt sheds at the side of the road in BC’s mountains. And for you true powder seekers out there, the measuring stick tops out at Mount Cain (15m), Powder King (12.5m) and Whitewater (12.1).
Mount Cain 15m
Powder King 12.5m
Whitewater 12.1m
Whistler 11m
Revelstoke 10m
Fernie 9m
Sunshine Village 8m
Big White 7m
Le Massif 6.5m
Kicking Horse 6m
Eastern Townships 5.2m
Panorama 5m
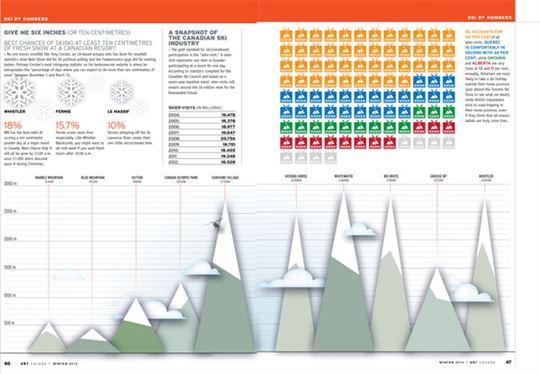
Give Me Six Inches (or Ten Centimetres)
Best chances of skiing at least ten centimetres of fresh snow at a Canadian resort:
» No one knows snowfall like Tony Crocker, an LA-based actuary who has done for snowfall statistics what Nate Silver did for US political polling and the Freakonomics guys did for naming babies. Perhaps Crocker’s most intriguing statistic on his bestsnow.net website is where he extrapolates the “percentage of days where you can expect to ski more than ten centimetres of snow” between December 1 and March 31.
Whistler 18%
WB has the best odds of scoring a ten centimetre powder day at a major resort in Canada. Best chance that it will all be gone by 11:00 a.m. once 17,000 skiers descend upon it during Christmas.
Fernie 15.7%
Fernie scores more than respectably. Like Whistler Blackcomb, you might want to ski mid-week if you want fresh tracks after 10:00 a.m.
Le Massif 10%
Storms whipping off the St. Lawrence River create their own little microclimate here.
A Snapshot of the Canadian Ski Industry
» The gold standard for ski/snowboard participation is the “skier-visit.” A skier-visit represents one skier or boarder participating at a resort for one day. According to statistics compiled for the Canadian Ski Council and based on a seven-year baseline trend, skier-visits will remain around the 18 million mark for the foreseeable future.
Skier-Visits (in millions)
2004: 19.478
2005: 18.378
2006: 18.977
2007: 19.047
2008: 20.756
2009: 18.701
2010: 18.405
2011: 19.348
2012: 18.528
Cross-Canada Peak-Up: the 10 Highest Mountain Resorts region-to region, east to West:
Marble Mountain 546m
Sutton 986m
Blue Mountain 452M
CanadA Olympic Park 1250m
Sunshine Village 2730m
Kicking Horse 2448m
Whitewater 2388m
Big White 2318m
Grouse Mt 1250m
Whistler 2284m
BC accounts for 45 per cent of all skier-visits. Quebec is comfortably in second with 24 per cent, while Ontario and Alberta are very close at 12 and 11 per cent, annually. Ontarians are most likely to take a ski holiday outside their home province (just attend the Toronto Ski Show to see what we mean), while British Columbians stick to road-tripping in their home province, even if they think that all-season radials are truly snow tires.
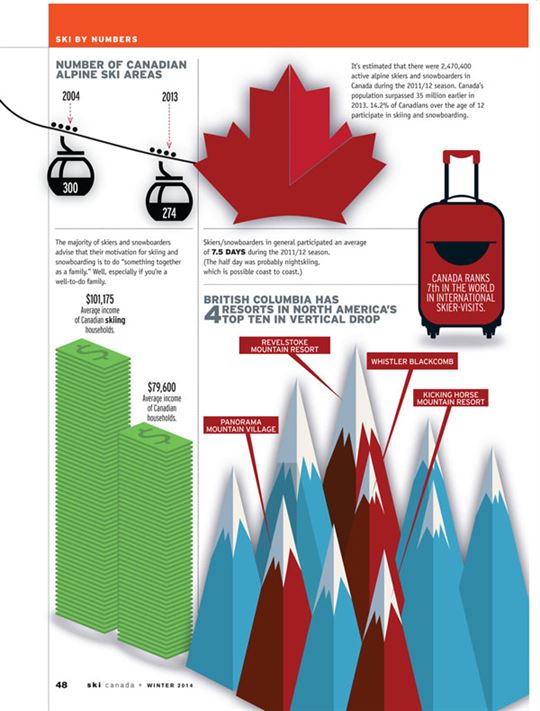
It’s estimated that there were 2,470,400 active alpine skiers and snowboarders in Canada during the 2011/12 season. Canada’s population surpassed 35 million earlier in 2013. 14.2% of Canadians over the age of 12 participate in skiing and snowboarding.
The majority of skiers and snowboarders advise that their motivation for skiing and snowboarding is to do “something together as a family.” Well, especially if you’re a well-to-do family.
$101,175 average income of Canadian skiing households
$79,600 average income of all Canadian households
Skiers/snowboarders in general participated an average of 7.5 days during the 2011/12 season. (The half day was probably nightskiing, which is possible coast to coast.)
Canada Ranks 7th in the world in international skier-visits.
British Columbia has 4 resorts in North America’s Top Ten in Vertical Drop
Revelstoke Mountain Resort
Whistler Blackcomb
Kicking Horse Mountain Resort
Panorama Mountain Village
